We run joyofexploringtheworld.com on a hybrid stack — Oracle edge for HTTP, a home EliteDesk for MariaDB and wp-cron, Cloudflare APO, imgproxy, and Datadog EU for observability. After a busy week of deploys and tuning, we ran a structured 24-hour error review.
The log index looked almost clean. That was the wrong place to start.
What we expected vs what we found Link to heading
| Source | 24h signal | Useful for triage? |
|---|---|---|
Log index (status:error) | 1 Traefik line | No — nearly empty |
| Error Tracking | imgproxy source errors, PHP fatals, bot noise | Yes |
| APM spans | Slow admin paths, high PHP compilation time | Yes |
| Monitors | TLS cert false alert, imgproxy 404s, 502/503 No Data | Mixed |
Our workflow is now: Error Tracking → APM → monitors → host verification → logs last.
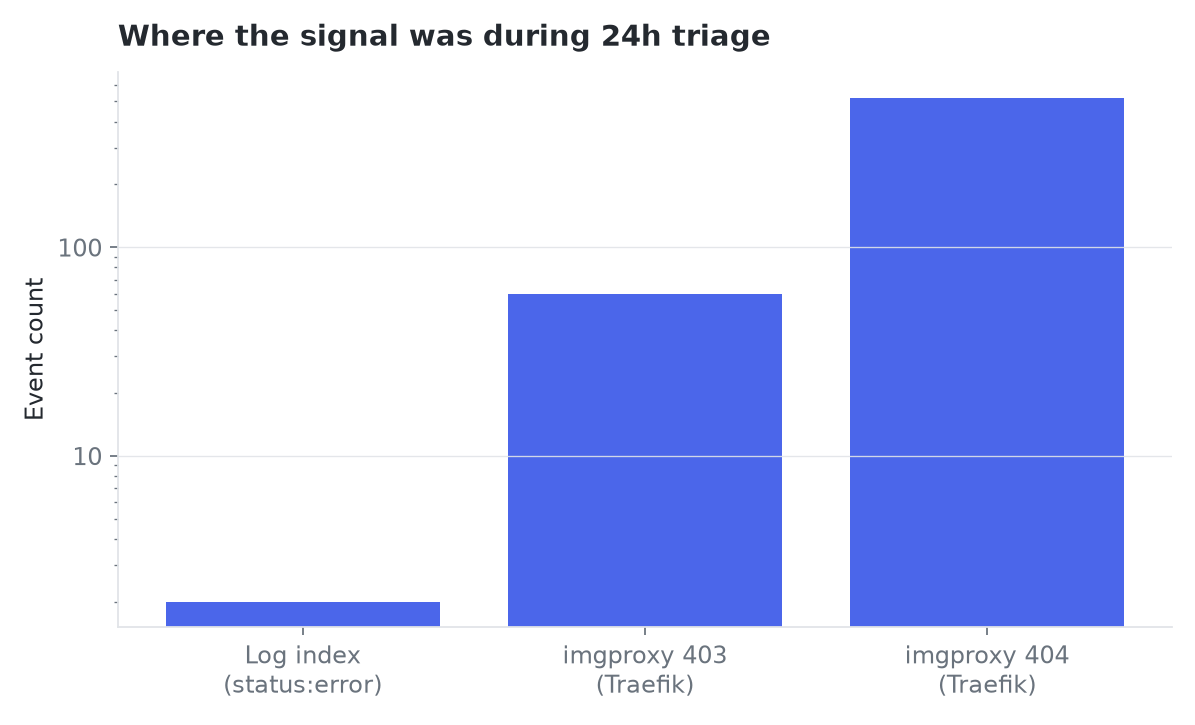
Live Datadog counts for the triage window (30 Jun–1 Jul 2026). The log index barely moved; imgproxy 404 at Traefik was the user-impact signal — not the 403s we had tuned for.
P0: a TLS monitor that lied after Traefik restarted Link to heading
A certificate-expiry monitor fired: “TLS cert expiring within 14 days.” Manual checks showed certs were fine — roughly 31 days remaining.
Root cause: after a Traefik container restart, the metric traefik.tls.certs.notAfterTimestamp stopped reporting for our Let’s Encrypt resolver. The monitor kept evaluating against stale data and stayed in Alert.
Fixes:
- Restart Traefik to restore cert metric emission (short-term).
- Scope the monitor to our public hostnames only — not every cert Traefik ever saw.
- Add
notify_no_dataso “metric gone silent” pages differently from “cert actually expiring.”
Lesson: infrastructure restarts can break reporting, not just the thing being monitored. No-data handling matters.
P1: imgproxy 404s, not the 403s we tuned for Link to heading
After moving media to Cloudflare R2, imgproxy only accepts HTTPS sources:
IMGPROXY_ALLOWED_SOURCES=https://media.example.com/
Our mu-plugin rewrites upload URLs to that CDN host — it never emits local:// in current code. Yet Error Tracking showed ~111 hits in 24 hours like:
Source URL is not allowed: local:///wp-content/uploads/2025/…/photo.jpg
Origin HTML from a fresh request was correct. Production pages still referenced signed local:// imgproxy paths. Redis and WordPress object cache were flushed; the errors continued until we purged Cloudflare APO (full HTML cache).
That incident deserves its own write-up — see Stale Cloudflare APO HTML After an imgproxy R2 Cutover. Here, the observability angle: we almost missed it because our imgproxy monitor watched code:403 while blocked sources returned 404.
We added:
- A combined imgproxy 403 + 404 error-rate monitor with a volume floor (
clamp_min) - A dedicated 404 /
security_errorlog monitor for imgproxy - Dashboard tiles for both status codes on the incident triage board
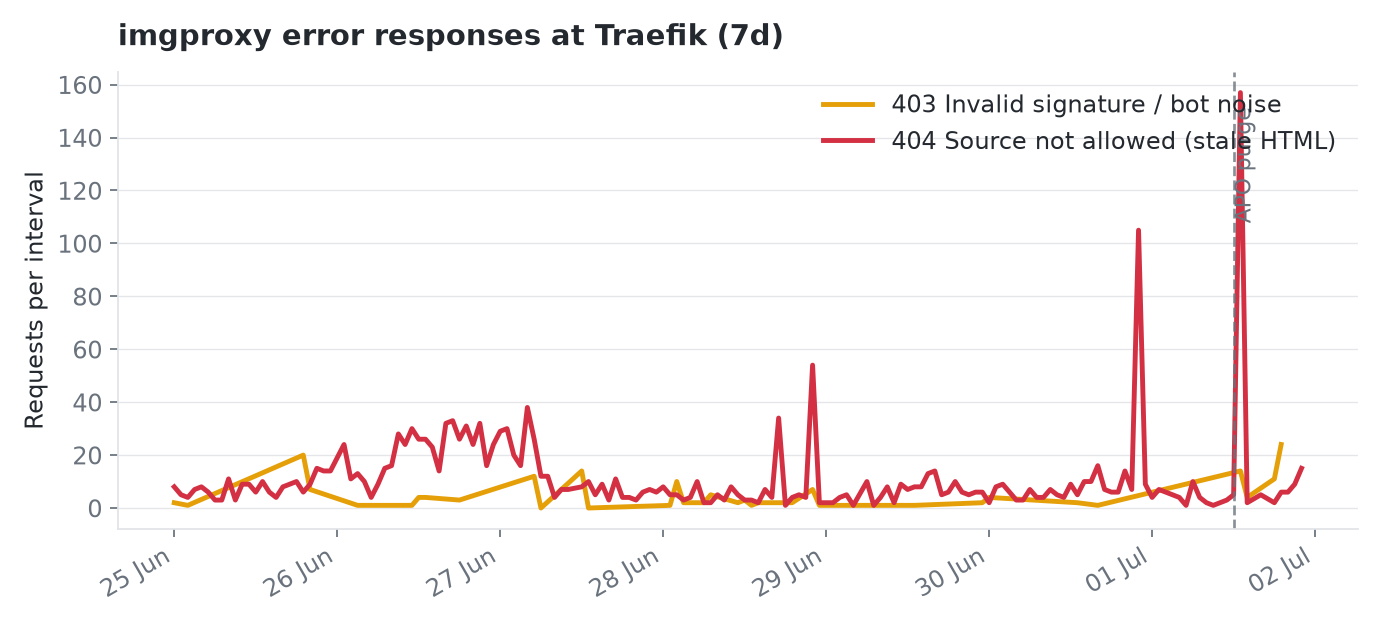
404 “source not allowed” dominated once stale HTML kept serving local:// URLs; 403 bot noise stayed a separate, smaller line.
Bot paths (robots.txt, ip, invalid signatures) still pollute Error Tracking — we marked those issues Ignored so real user-impact errors surface first. That complements the earlier imgproxy bot alert tuning work on 403 noise.
P2: the invisible wp-admin backend Link to heading
Traefik exposes two DogStatsD service tags on the same WordPress containers:
| Traffic | Traefik service: tag |
|---|---|
| Public site | wordpress_docker |
| wp-admin, wp-login, wp-json, admin-ajax | wordpress-admin_docker |
Our 502/503 monitor queried only service:wordpress_docker. Admin-only failures showed as No Data — not OK, not Alert, just invisible.
Any monitor or dashboard for HTTP errors, latency, or availability on this stack must sum or OR both tags. Same rule for the incident triage dashboard JSON we keep in git and apply via script (or Datadog API from a dev machine when an Application Key is not on the host).
P3: noise we could safely ignore Link to heading
Not everything in Error Tracking is an incident:
| Pattern | Count (24h) | Action |
|---|---|---|
imgproxy Invalid path: robots.txt | ~101 | Ignore in Error Tracking |
imgproxy Invalid path: ip | ~92 | Ignore |
| imgproxy invalid signature | ~53 | Ignore (bots; see bot alert post) |
Site Kit fatal (missing Pointer.php) | 1 | Partial plugin update; file present on disk |
curl 1001ms timeout to admin-ajax.php?action=as_async_request_queue_runner | ~36 | Expected — Action Scheduler loopback under load |
We also added Error Tracking monitors for new PHP fatals so the next real fatal does not wait for a manual review.
What we changed in the runbook Link to heading
- Triage order — Error Tracking and APM before log search.
- Dual-service queries — every Traefik metric alert includes both WordPress service tags.
- imgproxy status codes — monitor 403 and 404; security denials are not always 403.
- TLS monitors — hostname scope + no-data notification.
- Dashboard as code — incident triage JSON in git; apply after edits so the board matches monitors.
Example 502/503 query shape (both backends):
sum(last_5m):sum:traefik.service.request.total{
  (service:wordpress_docker OR service:wordpress-admin_docker),
  code:502
}.as_count()
What you can do Link to heading
- Run a 24h review starting in Error Tracking, not Logs — especially on PHP apps where stderr may not reach your log pipeline.
- List every Traefik
service:tag your stack emits; grep monitors and dashboards for missing tags. - After imgproxy or CDN changes, check 404 rate, not just 403 — allowlist rejections may not match your old alert.
- Add
notify_no_dataon metrics that can stop reporting after restarts. - Keep monitor JSON in git; document apply steps so tuning survives the next incident.
Patterns transfer to any APM stack — we happen to use Datadog on Docker with Traefik DogStatsD.
See also: When Datadog Alerts Are Bots, Not Outages (imgproxy srcset Noise) | Hybrid WordPress: Free Oracle VM + Home EliteDesk over IPSec | Why Our Site Went Down for an Hour
Built for a travel blog on a budget. This stack powers Joy of Exploring the World — curated travel itineraries, restaurant reviews, and destination guides. If you're planning your next trip, come explore with us.
All config files from this post are in the companion GitHub repo.