We already wrote about wp-admin slowness from Apache worker starvation and Jetpack routing — four prefork workers per container, thirty parallel block-editor REST calls, and a second Traefik service to spread admin traffic across replicas.
After that work, wp-admin was better but still sluggish on heavy editing days. Datadog APM pointed somewhere we had not looked: PHP OPcache was completely full, and our production ini file was losing a load-order fight with the Docker image defaults.
The symptom Link to heading
Over seven days, admin Traefik p95 latency sat around ~2.1s vs ~0.68s on public traffic — expected admin overhead, but the block editor still felt wrong.
We ruled out the usual suspects:
| Check | Result |
|---|---|
| Redis | ~12 MB used of 1.5 GB; zero evictions |
| MariaDB over IPSec | ~1 ms RTT; zero slow queries |
| Apache worker saturation | ~31–47% busy average; spikes only while editing |
APM on post.php and /wp-json/* showed high php.compilation.total_time_ms — cold workers spending up to tens of seconds compiling PHP before executing plugin code.
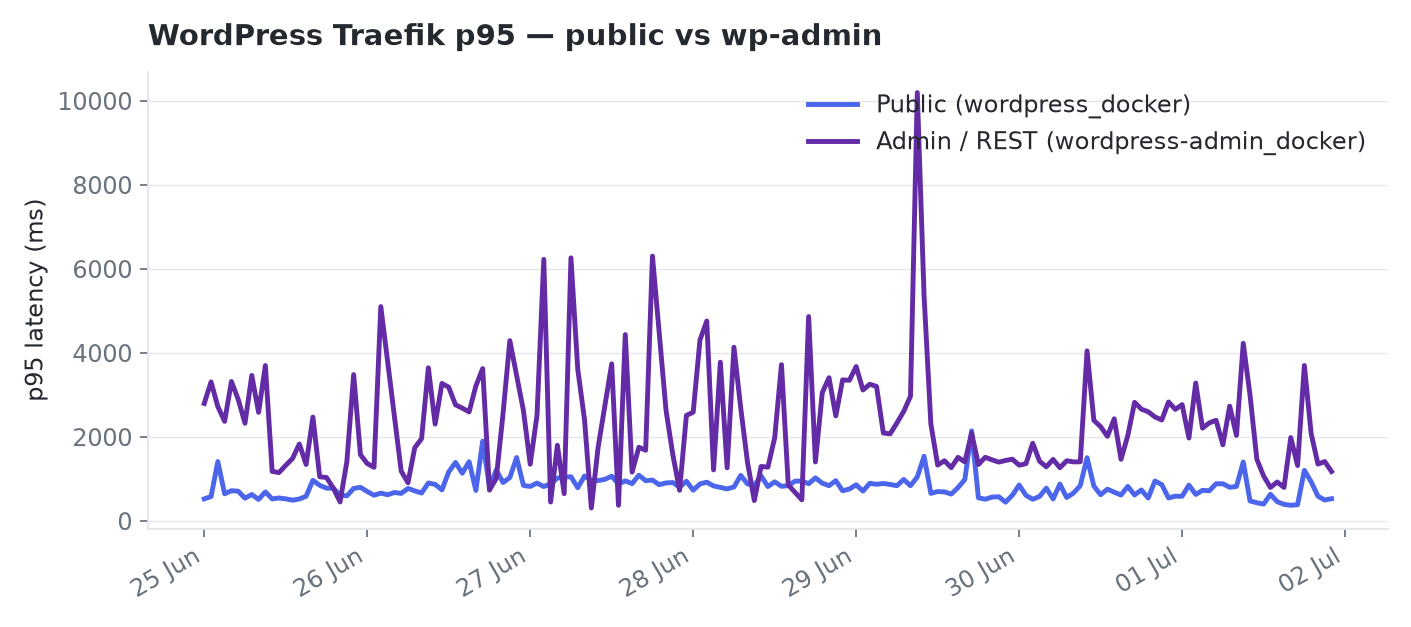
Admin and REST traffic (wordpress-admin_docker, purple) ran roughly 3× the public p95 over the same week — worker routing was fixed, but compile time on heavy plugin bootstraps was still high.
OPcache by the numbers Link to heading
Inside a running WordPress container:
| Metric | Live value | Config target |
|---|---|---|
| Cached scripts | 4,106 | max 4,000 |
| Memory used | 127.5 / 128 MB | 256 MB (intended) |
| Free memory | 0 MB | — |
cache_full | true | false |
With 48 active plugins, admin bootstraps far more files than the front page. A full OPcache forces constant recompilation and eviction churn — worker limits hurt, but even idle workers pay compile tax on every new file that does not fit.
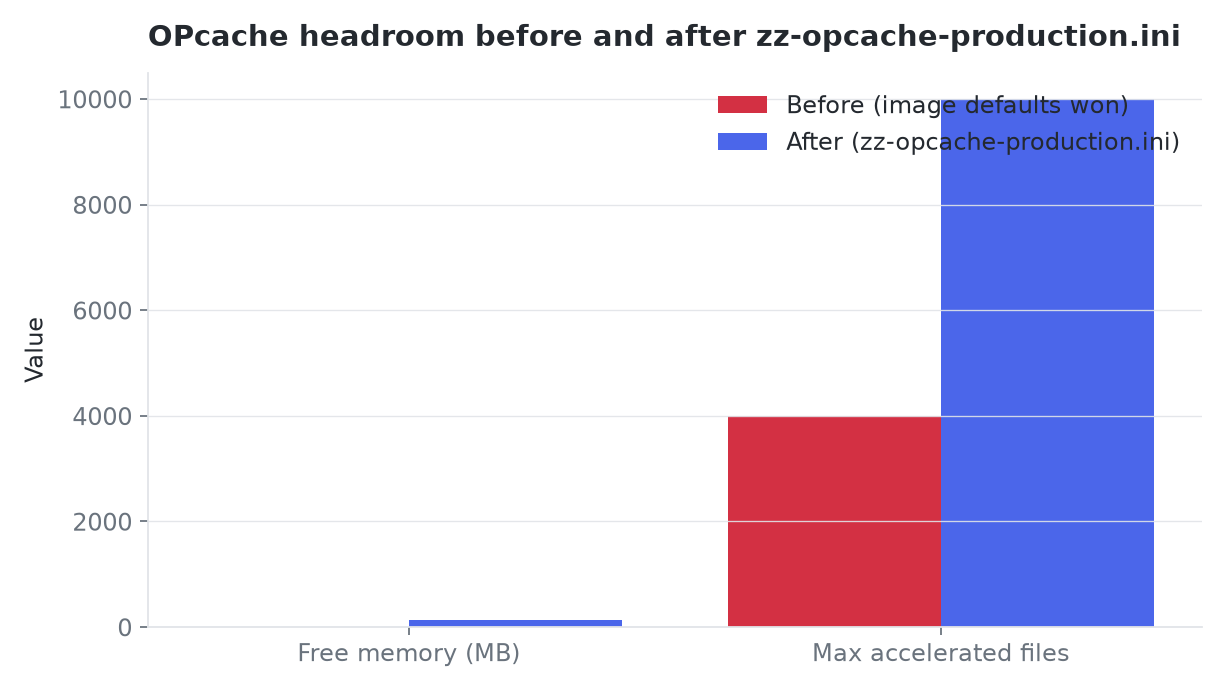
In-container opcache_get_status() before and after deploy — not a Datadog metric, but the ground truth that explained the APM compile spikes.
Why our 99-opcache.ini did not win
Link to heading
We had production tuning in git:
; config/php/99-opcache.ini
opcache.validate_timestamps=0
opcache.memory_consumption=256
The official wordpress Docker image also ships opcache-recommended.ini — loaded later in PHP’s conf.d order — pinning:
opcache.memory_consumption=128
opcache.max_accelerated_files=4000
Alphabetical load order meant opcache-recommended.ini overrode our file. We thought we had 256 MB and generous file limits; production ran 128 MB / 4,000 files. Silent misconfiguration — no error log, just slow admin.
The fix: load last on purpose Link to heading
We added zz-opcache-production.ini so it sorts after the image defaults:
; config/php/zz-opcache-production.ini
; Loads after the image's opcache-recommended.ini (128 MB / 4000 files).
opcache.memory_consumption=256
opcache.max_accelerated_files=10000
opcache.interned_strings_buffer=16
Mount it in docker-compose.yml alongside the existing ini:
volumes:
  - ./config/php/99-opcache.ini:/usr/local/etc/php/conf.d/99-opcache.ini:ro
  - ./config/php/zz-opcache-production.ini:/usr/local/etc/php/conf.d/zz-opcache-production.ini:ro
After redeploy:
| Metric | Before | After |
|---|---|---|
| OPcache free memory | ~0 MB | ~141 MB |
cache_full | true | false |
| max accelerated files | 4,000 | 10,000 |
Validate in-container with php -i | grep opcache or your APM vendor’s PHP runtime metrics — do not trust git alone.
What else we mitigated (without adding a third replica) Link to heading
OPcache was the high-impact fix. Two smaller changes reduced parallel admin load:
1. Jetpack spawn-sync coalescing Link to heading
The block editor triggers many authenticated REST requests. Jetpack’s spawn-sync endpoint was firing ~1,900 times per 24 hours, often in duplicate during bursts.
We extended our mu-plugin to defer spawn-sync when six or more logged-in REST requests are already in flight — coalescing duplicate workers instead of queueing more Apache processes.
2. Action Scheduler off the edge Link to heading
Easy Digital Downloads uses Action Scheduler, which loopbacks to:
/wp-admin/admin-ajax.php?action=as_async_request_queue_runner
Those curl timeouts in Error Tracking were expected under load but wasted edge workers. We set ACTION_SCHEDULER_RUNNER=false on the Oracle edge; wp-cron on the home batch host runs the queue instead — same pattern as running WordPress cron the right way in Docker.
3. Dropped misleading Traefik middleware on admin Link to heading
Admin routers had a high inflight limit middleware while Apache still capped at eight PHP workers fleet-wide (4 × 2 replicas). Traefik was not the bottleneck; removing the middleware avoided false confidence without changing capacity.
We did not add a third WordPress replica — memory math on a 24 GB edge host (8192m per container × 3 ≈ 24 GB before Traefik, Redis, and imgproxy) left no headroom. Raising MaxRequestWorkers without raising mem_limit still risks OOM: four workers × 1536M PHP ≈ 7.4 GB peak per container.
What you can do Link to heading
- Inspect live OPcache, not just ini files —
opcache_get_status()or APM compile time on admin paths. - Name production overrides so they load last (
zz-*.ini) when the base image ships its own OPcache recommendations. - Count active plugins — large admin plugin stacks need headroom beyond 128 MB / 4,000 files.
- Split batch work (Action Scheduler, wp-cron) from the public edge when you run a hybrid stack.
- Treat worker tuning and OPcache tuning as separate problems; fixing one does not fix the other.
We still have a plugin audit on the backlog (48 → target under 35). OPcache headroom was the surprise win — the kind of issue that shows up in APM, not in an empty log index. See APM-first incident triage for that workflow.
See also: Why wp-admin Was Painfully Slow on a 4-Worker WordPress Docker Stack | How We Sped Up Our Travel Blog (Without Changing Hosts) | Hybrid WordPress: Free Oracle VM + Home EliteDesk over IPSec
Built for a travel blog on a budget. This stack powers Joy of Exploring the World — curated travel itineraries, restaurant reviews, and destination guides. If you're planning your next trip, come explore with us.
All config files from this post are in the companion GitHub repo.